Alerts Section
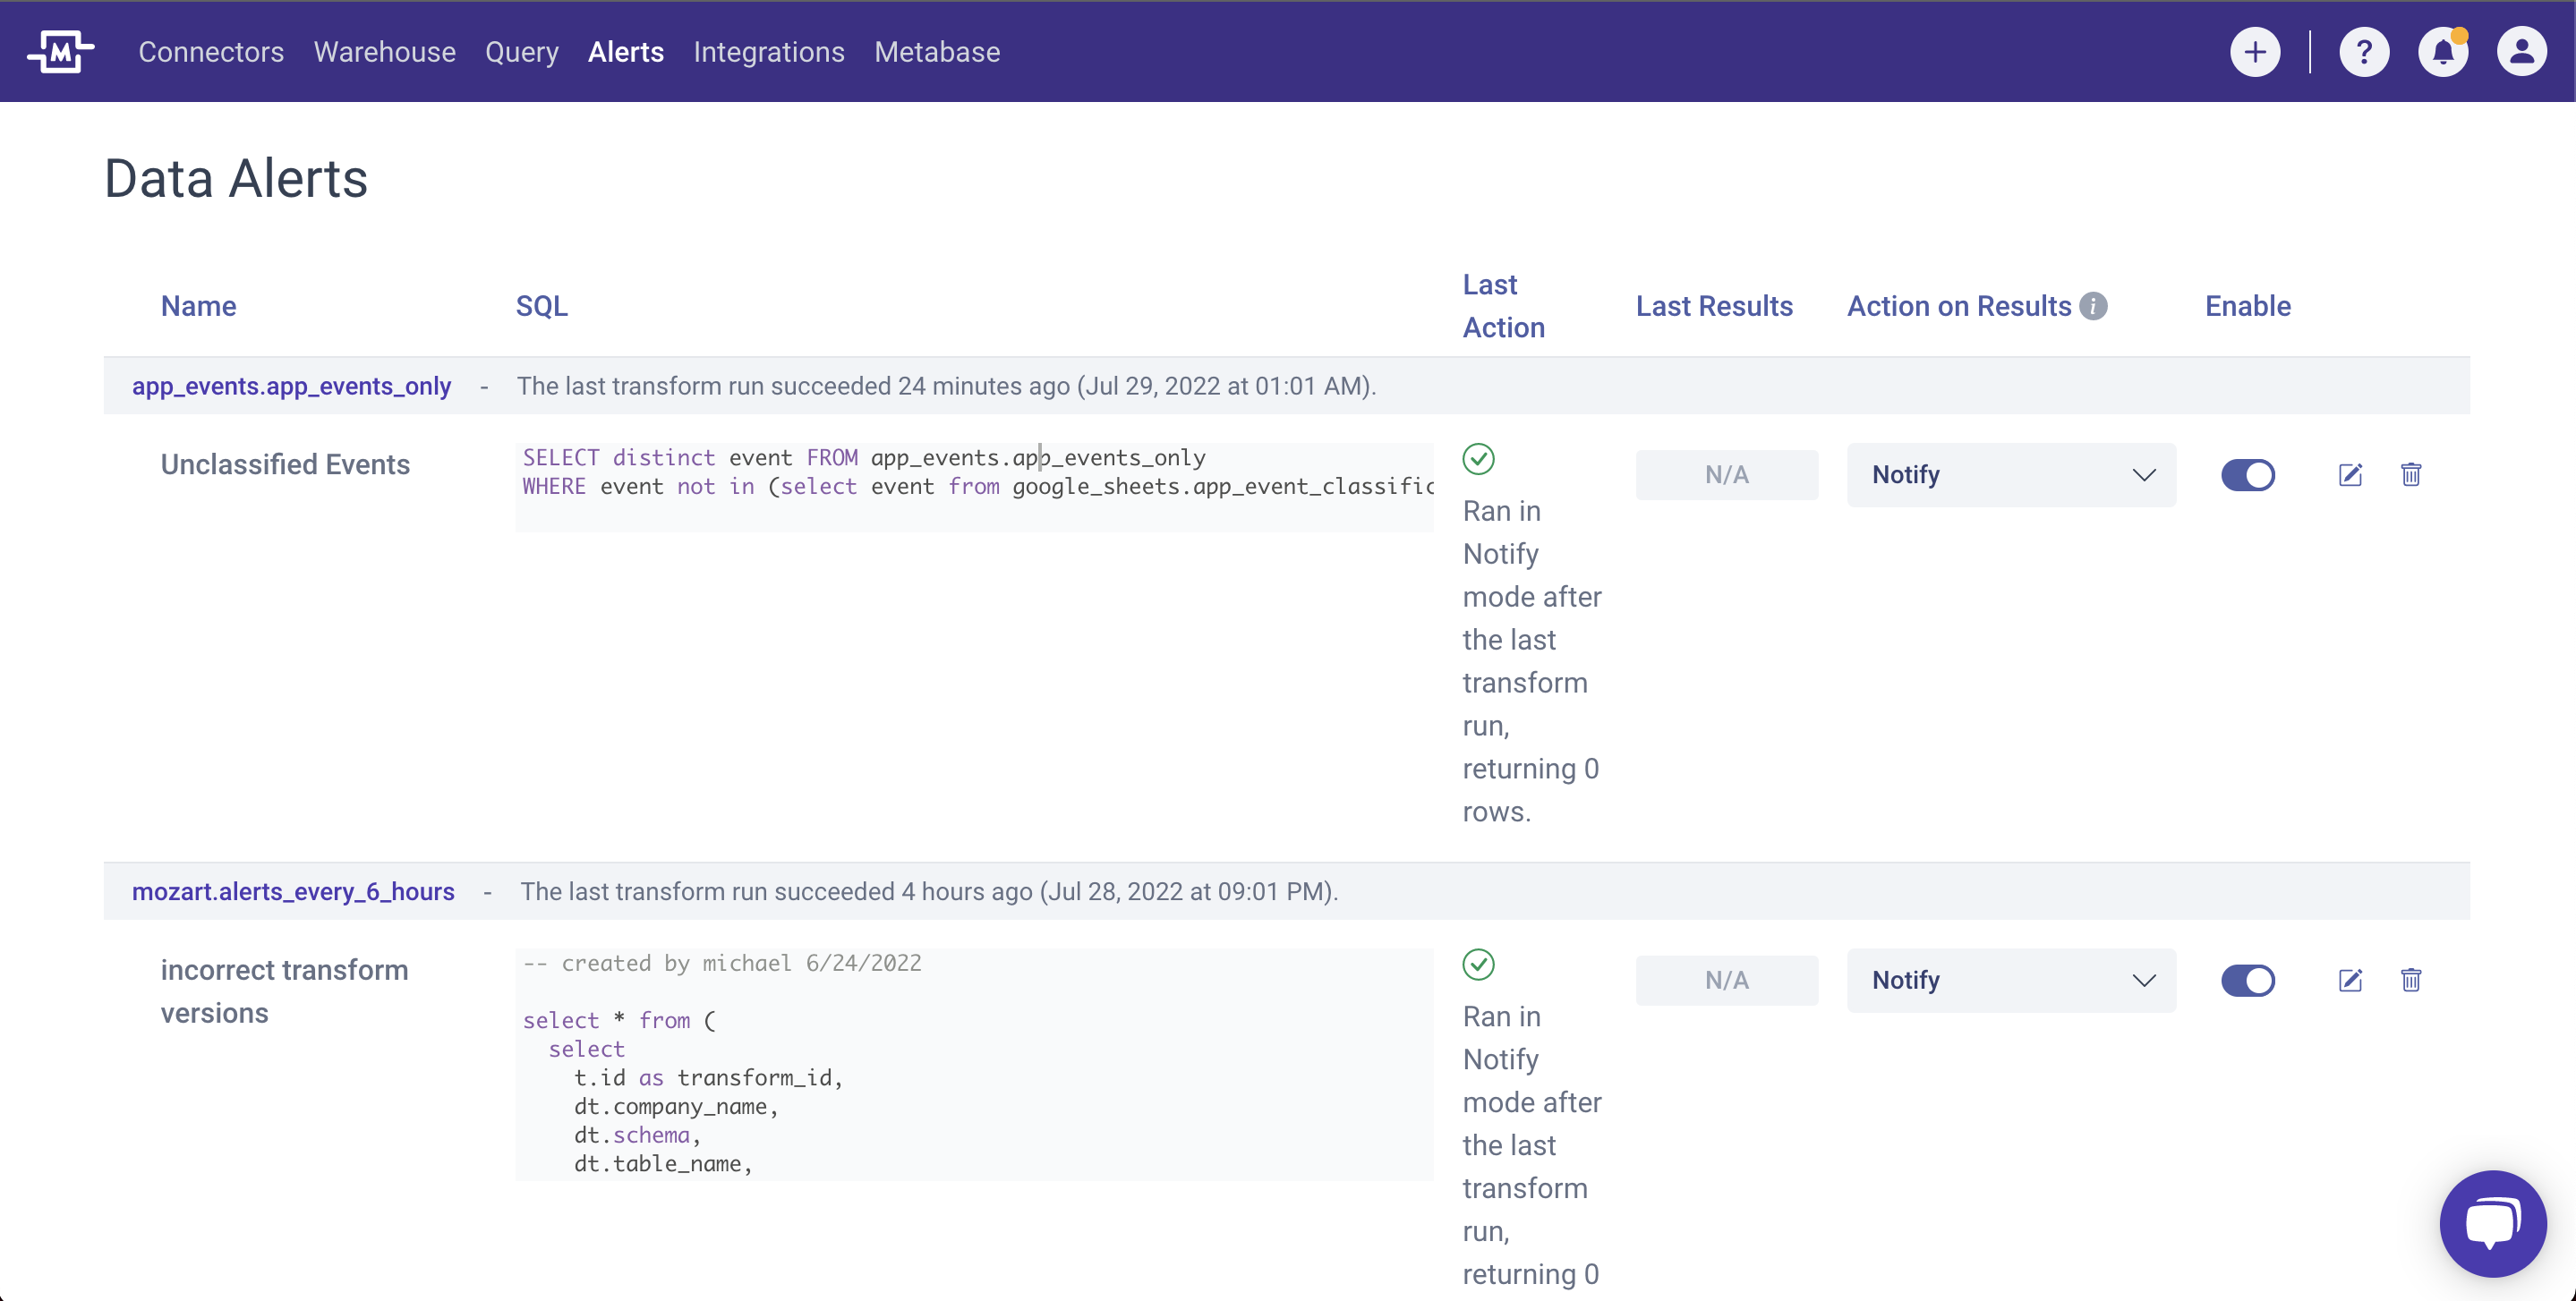
Data Alerts now have their own section in the top navigation bar.
On your data alerts page, you can be able to view and manage all of your data alerts on one page.
No more searching through individual transforms to find or adjust data alerts.
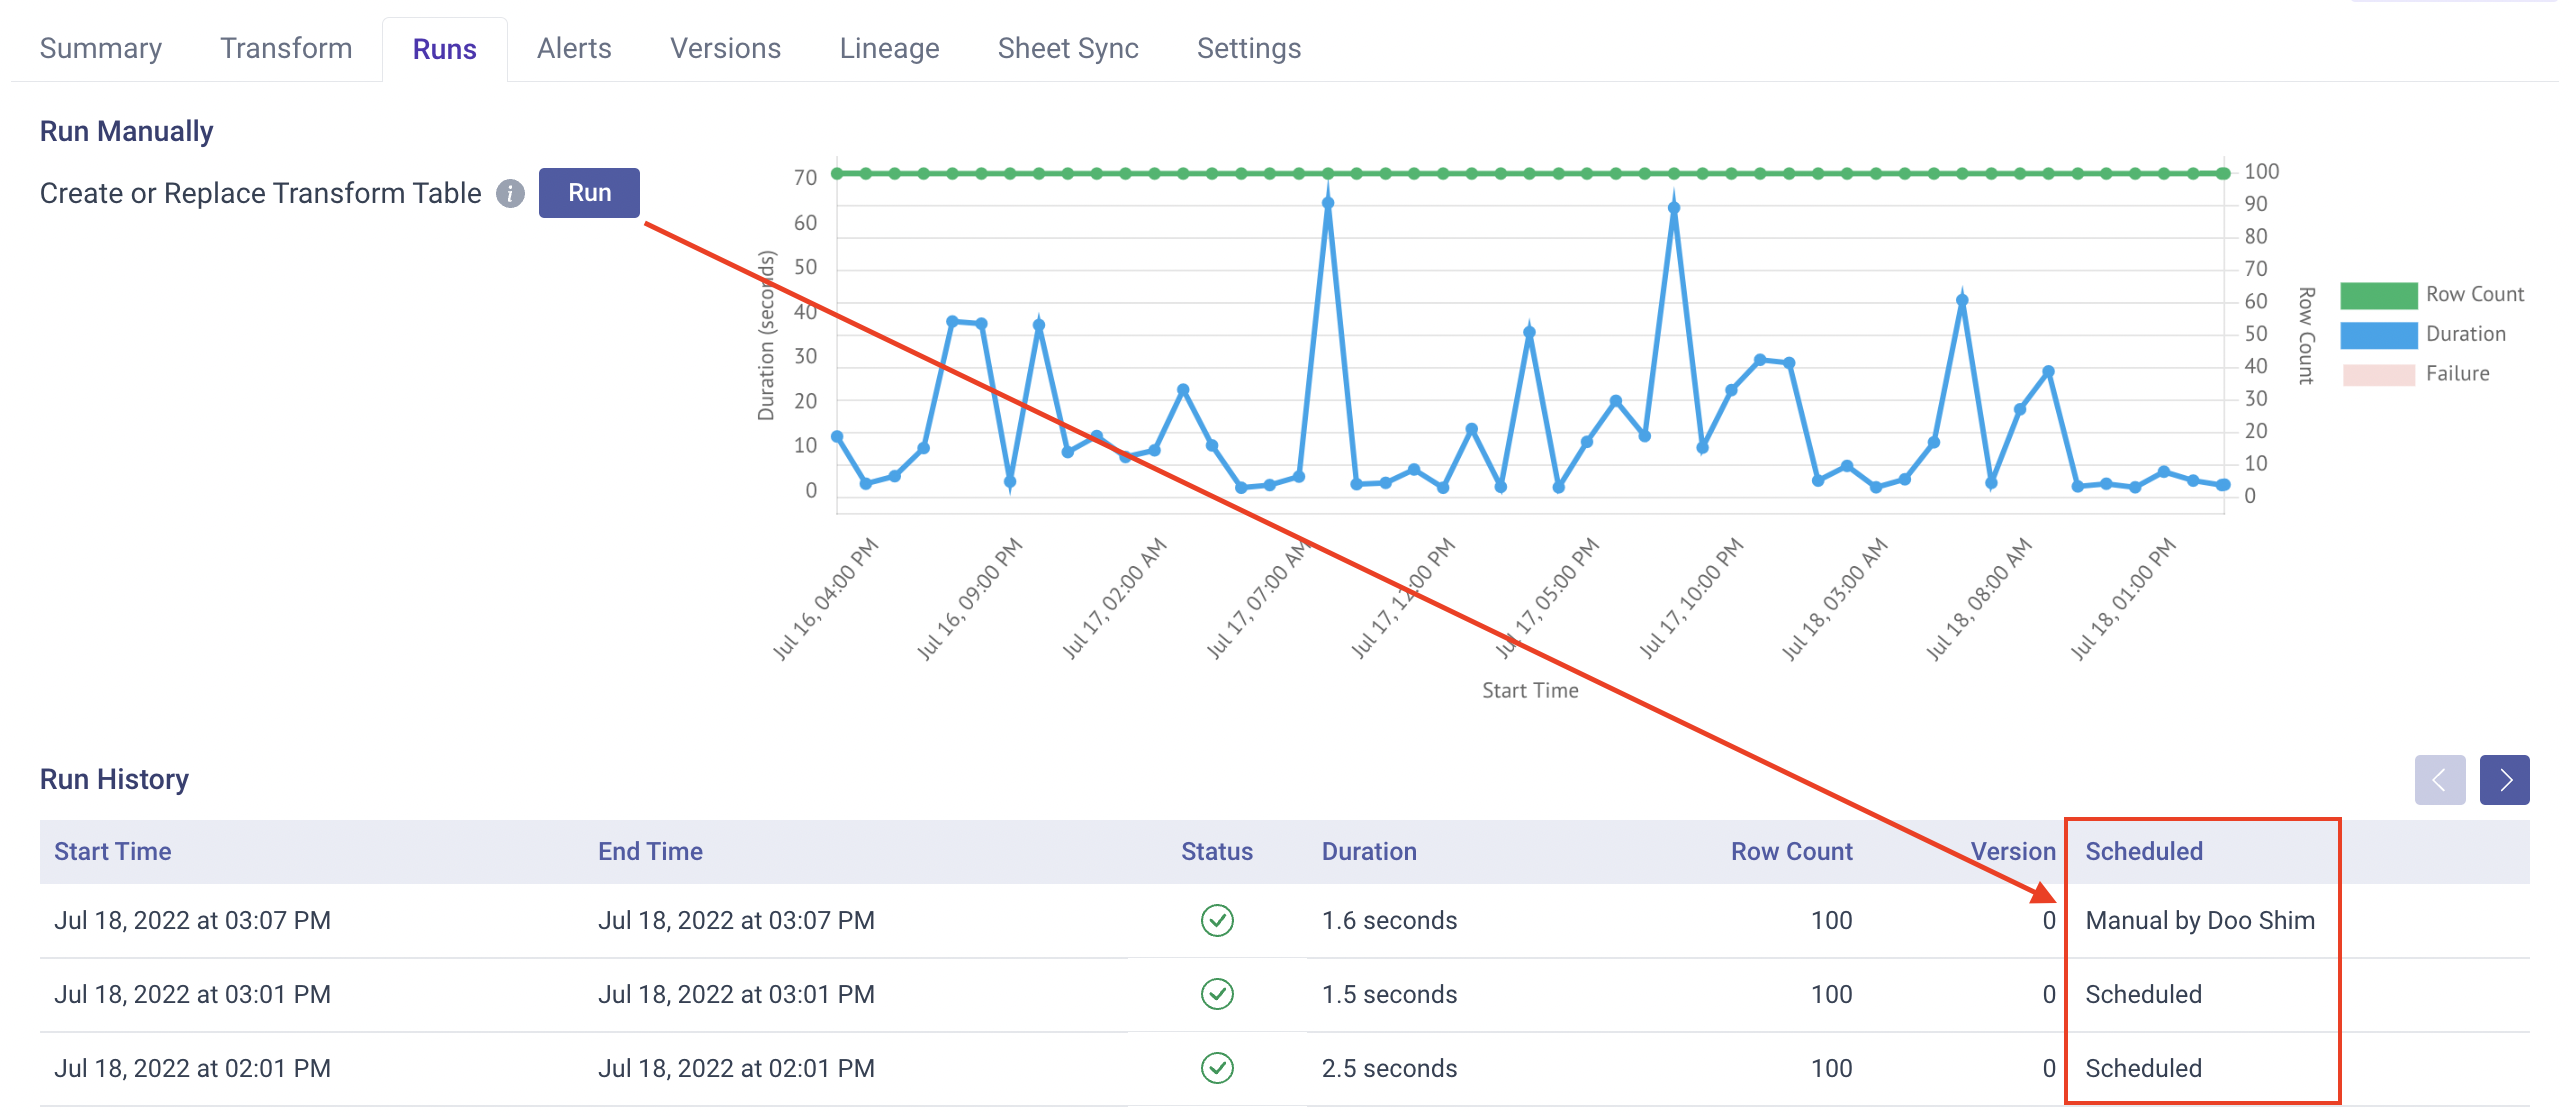
Manual Transform Runs
To re-run a transform outside of the scheduled frequency, users go to the "Runs" tab and manually run the transform. We made a minor improvement by adding the name of the user who manually re-ran the transform. This allows teams to track who ran the transform outside of the scheduled hours and understand reasons during debugging process.
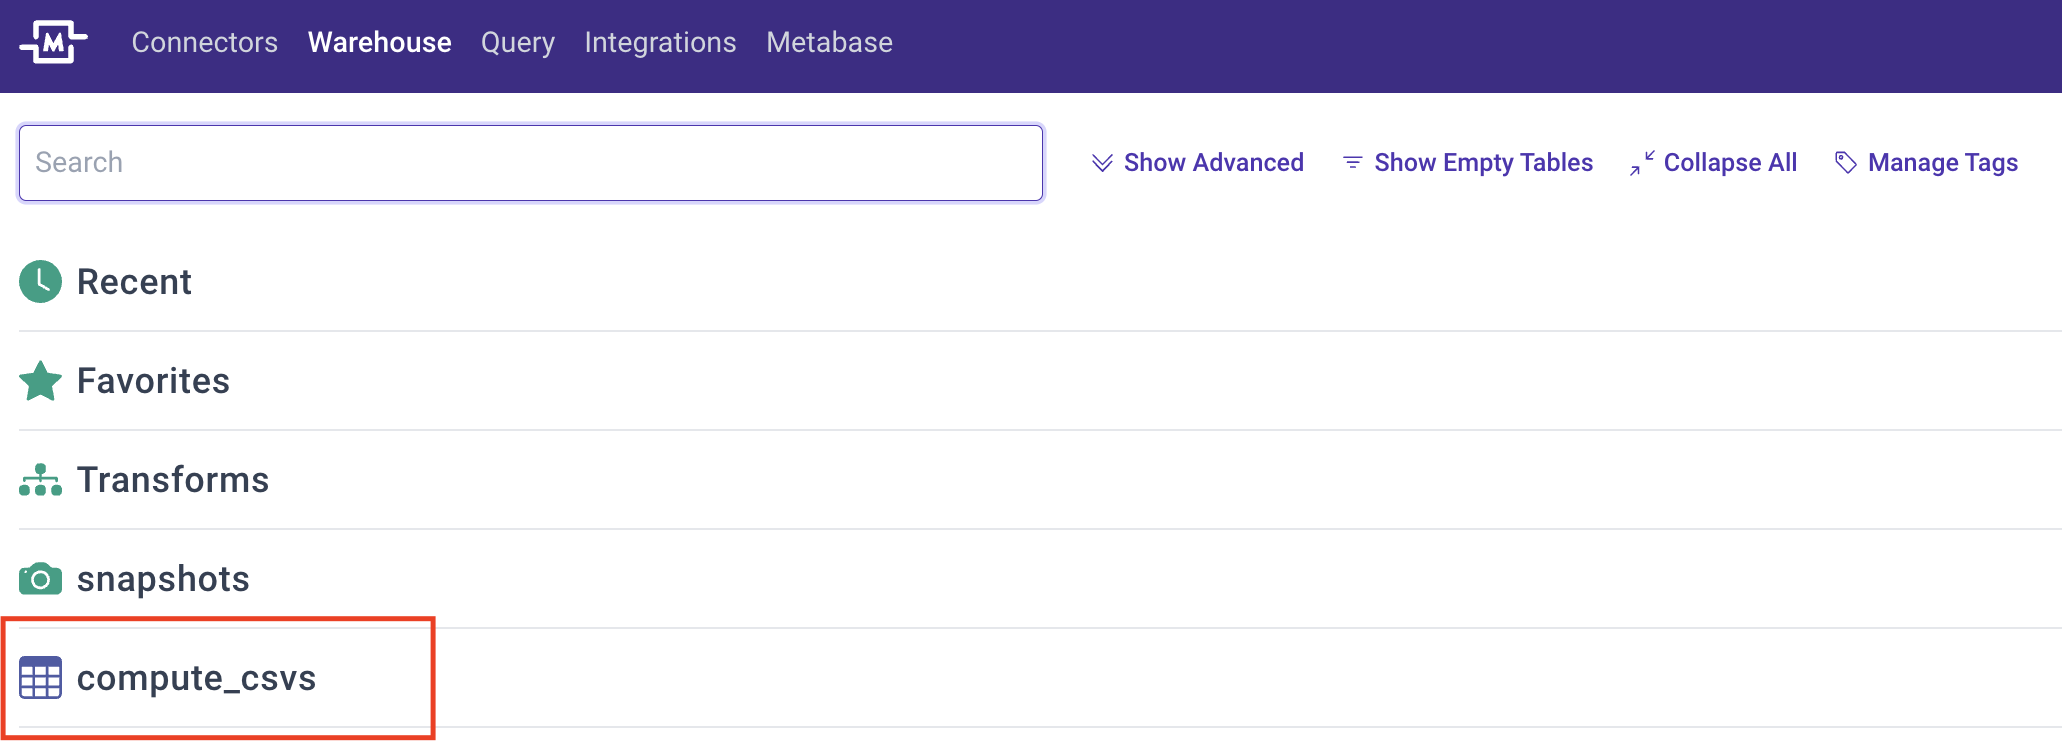
Unmanaged & Loaded Tables Icon
We recently added a new icon for unmanaged tables on the Warehouse page. The question mark icon led to frequent confusion by our users, so we have addressed in this month.
In the Warehouse page, we display connector tables, transforms, and snapshot tables along with the relevant icons to indicate the data types or sources. For unmanaged tables, such as views and loaded tables, we previously displayed a question mark ("?") icon to indicate that the table exists in Snowflake, but is not managed by Fivetran or Mozart Data.