Overview
With Report Builder, you can automate the transformation process to create analytics-ready data models and generate a Google Sheet report to get an overview of the top-of-mind metrics without writing a single line of SQL. Once Report Builder is finished building the transforms, you can modify the SQL and use any other business intelligence tools to further analyze and visualize the data.
Report Builder is currently available for Shopify and Stripe. We will be expanding the availability to other popular connectors soon.
🚀 Let's Get Started!
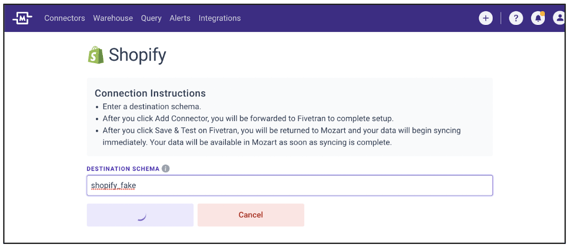
1. Follow the normal process for adding a new connector.
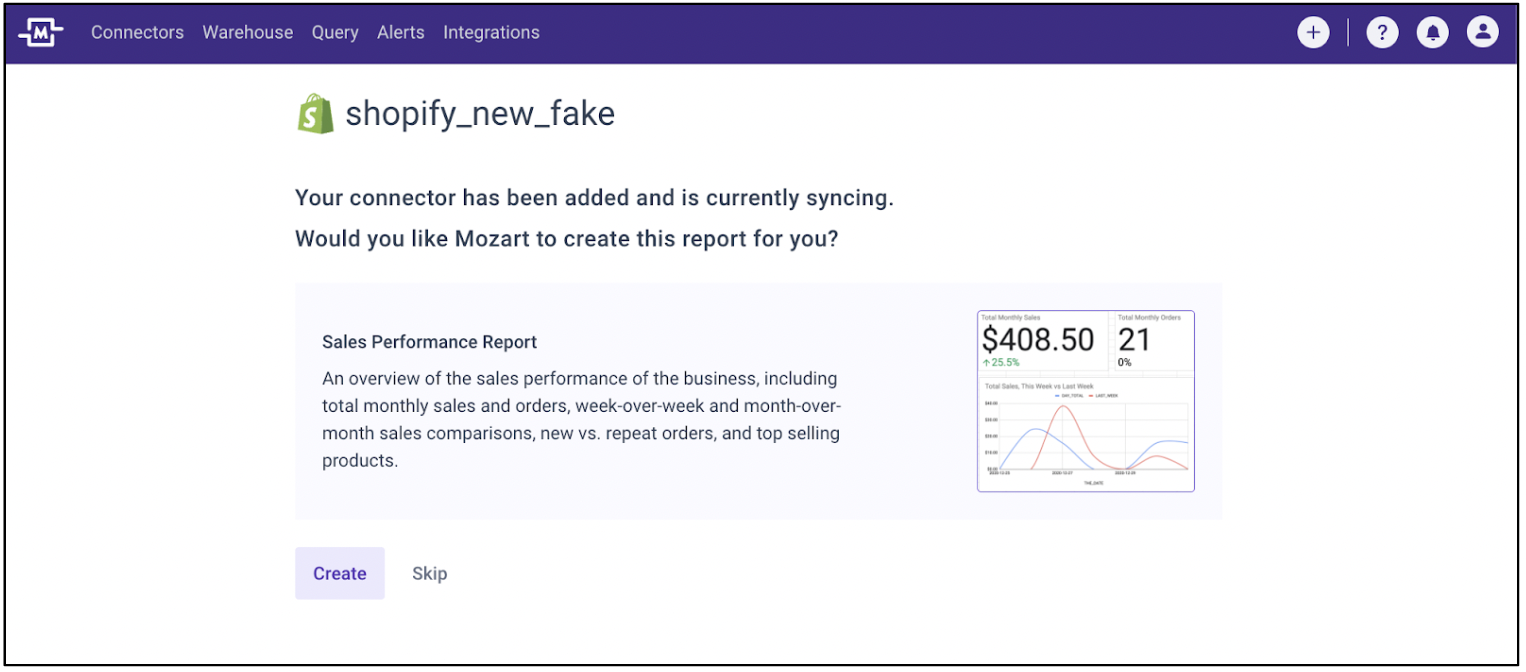
2. Once the connector has been successfully added and the data begins syncing, you will be prompted the following screen and message. Click Create to continue.
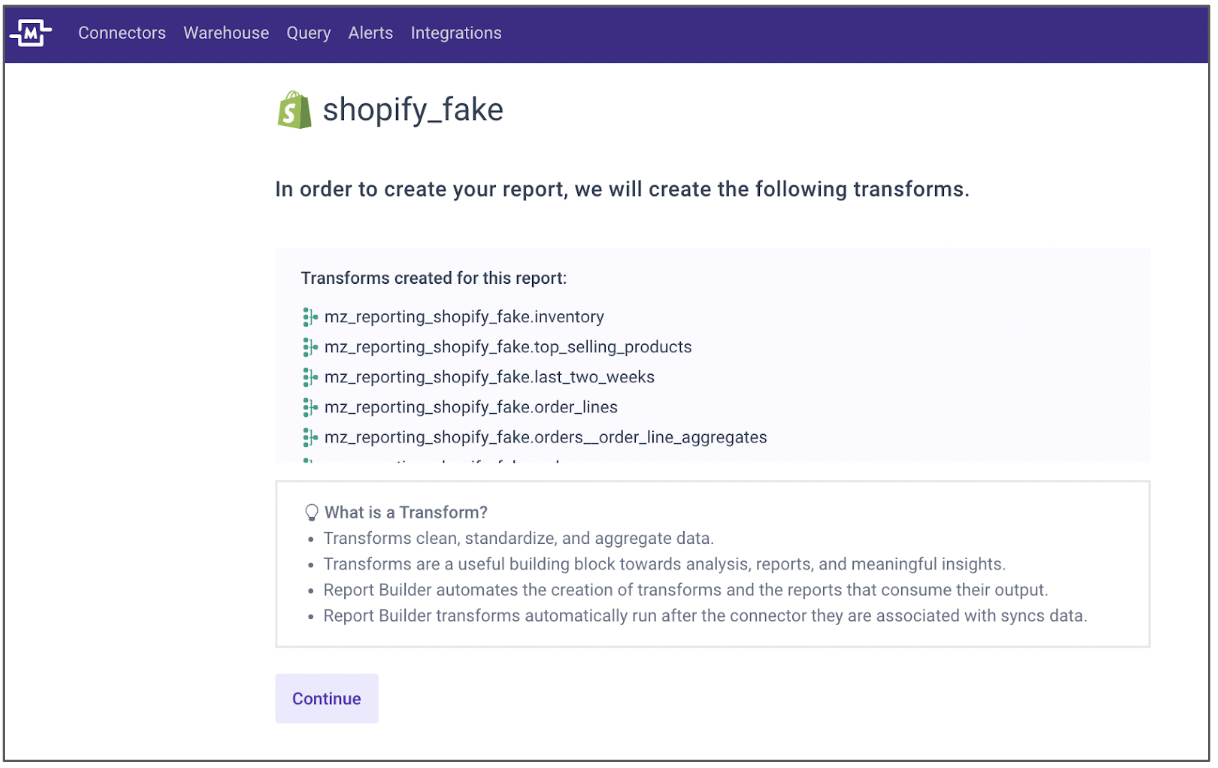
3. Once you click ‘Create’, Mozart will list and confirm the transforms that will be automatically created by Report Builder. These transforms are required to create the report for you. Click Continue.
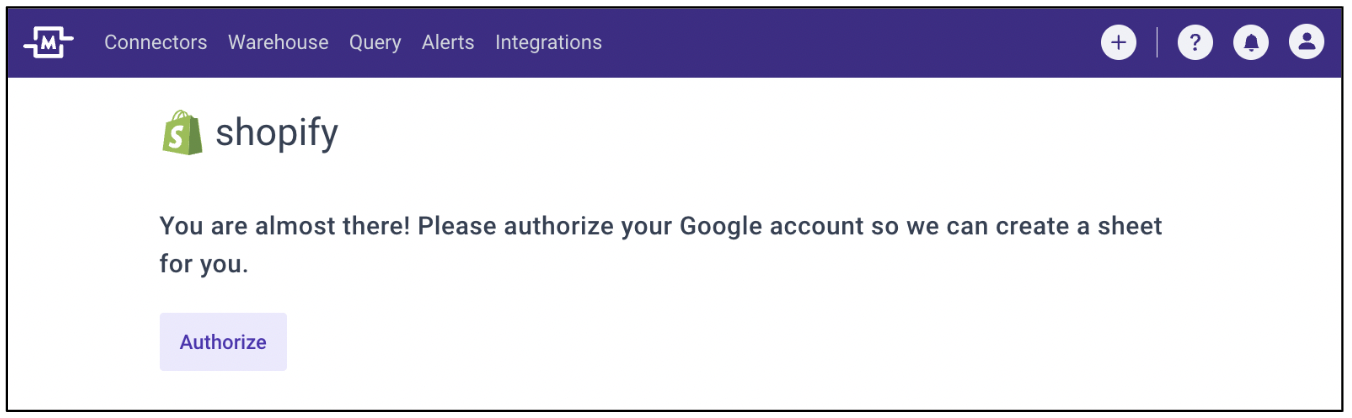
4. Finally, authorize your Google account to enable Report Builder to create a Google Sheet report with the charts for you.
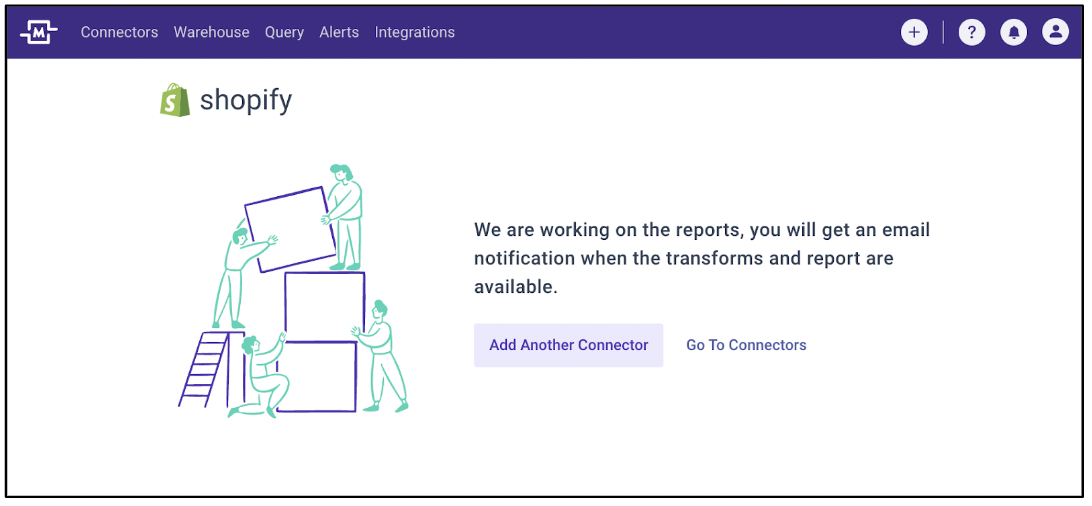
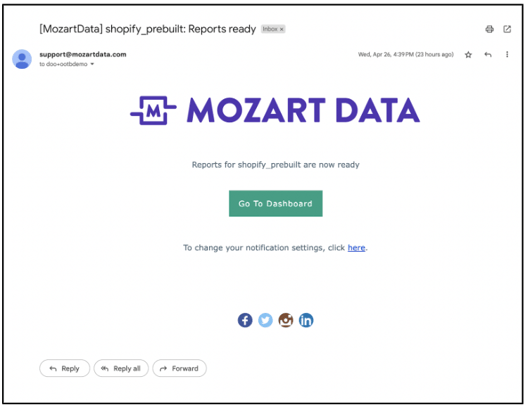
5. Once the transforms and reports become available, you will receive an email from us. Click 'Go To Dashboard' to be redirected to the Google Sheet and view the charts.
This is the sample preview of a report that will be created for you.
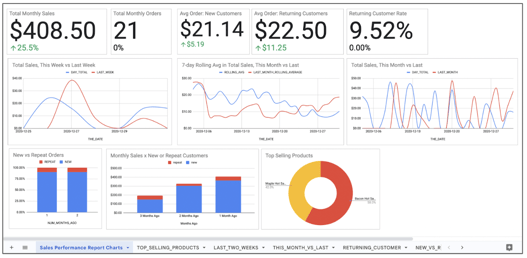
There are three components to the Google Sheet output:
- Report Charts: These are the charts and graphs that represent the top-of-mind business metrics.
- Data Exports: These are the data exports (mostly aggregated) that are used to build the report. These will be useful for diving deeper in to a particular metric and/or day, week, or month that you need to further investigate.
- SQL Reference: These are the copies of the transforms that were automatically built by Report Builder.
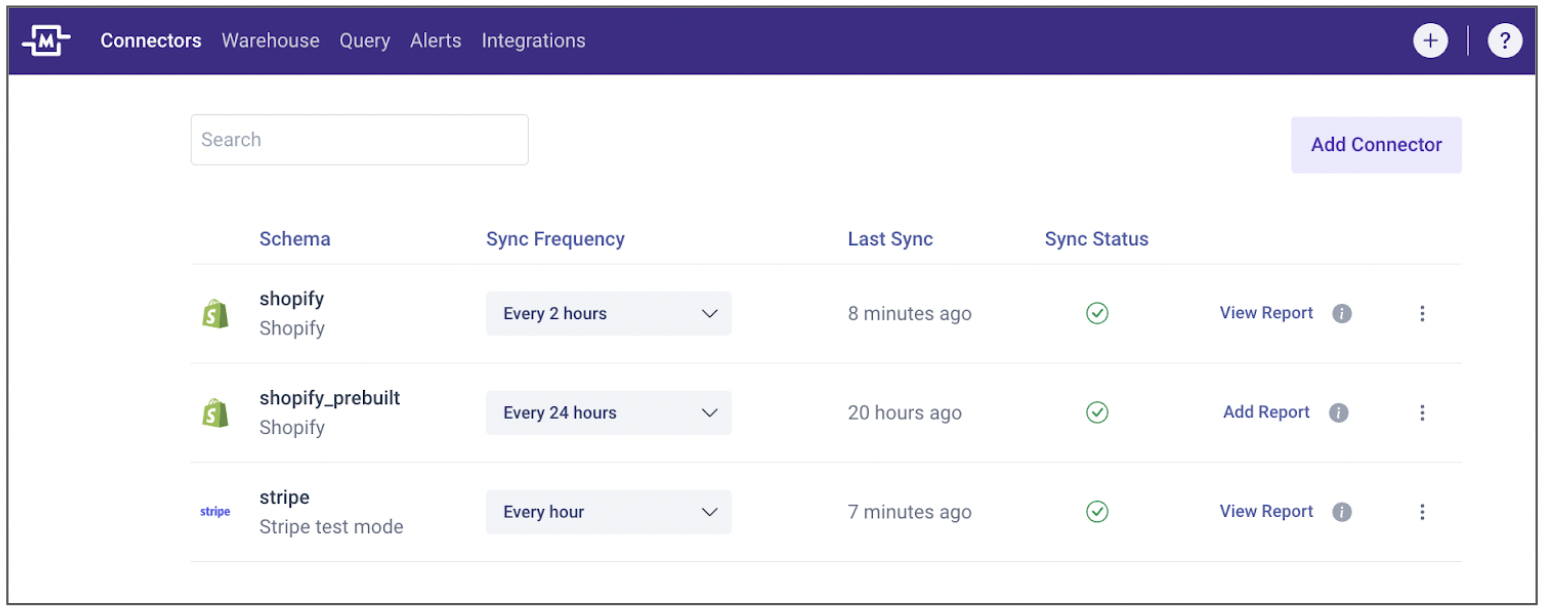
6. To add report to an existing connector, go to the Connector page. You can also access the transforms and reports built by Report Builder in here.
In the Report Builder page, you will be able to click 'Open Report' to go to the Google Sheet report, see the full details of the analytics-ready transforms that also support the report, and click 'View Data' to preview the data.
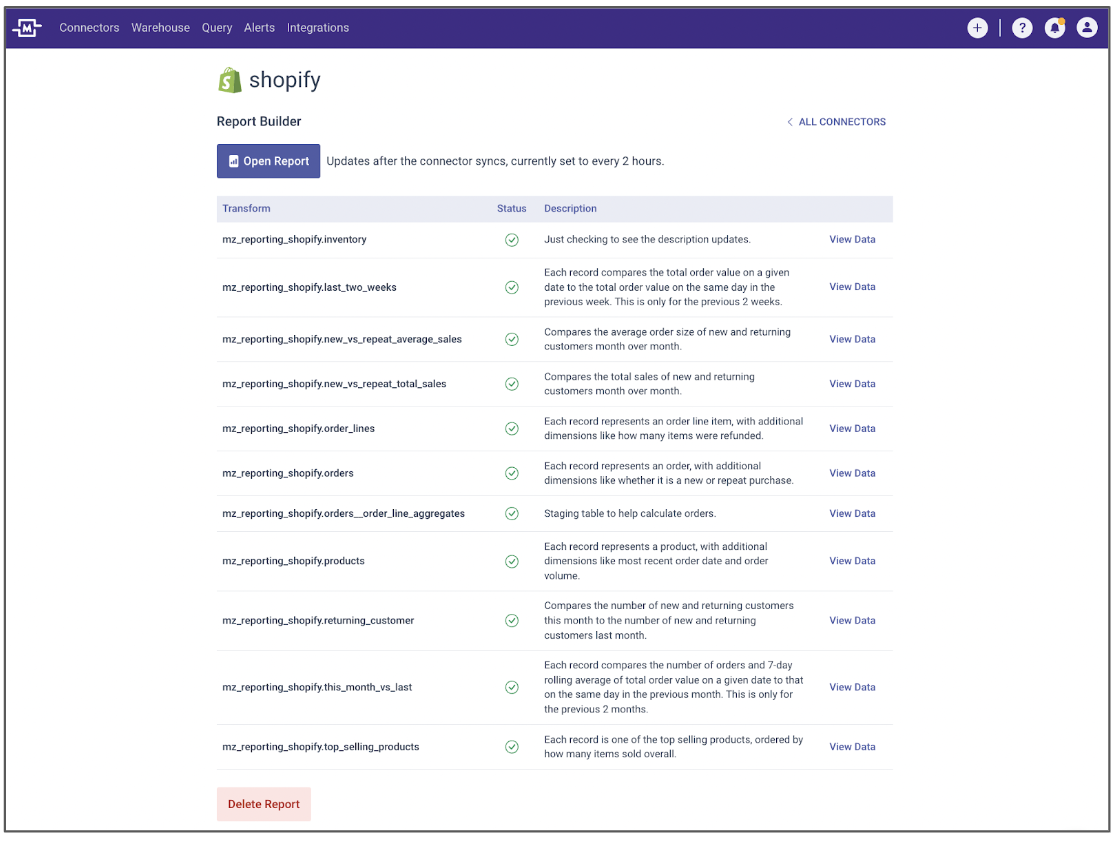
Clicking 'Delete Report' will delete the transform. You will be able to click 'Add Report' from the Connector page to rebuild the transforms and the report.
7. Transforms can also be accessed from the Warehouse page and queried in Mozart, or any BI tool.
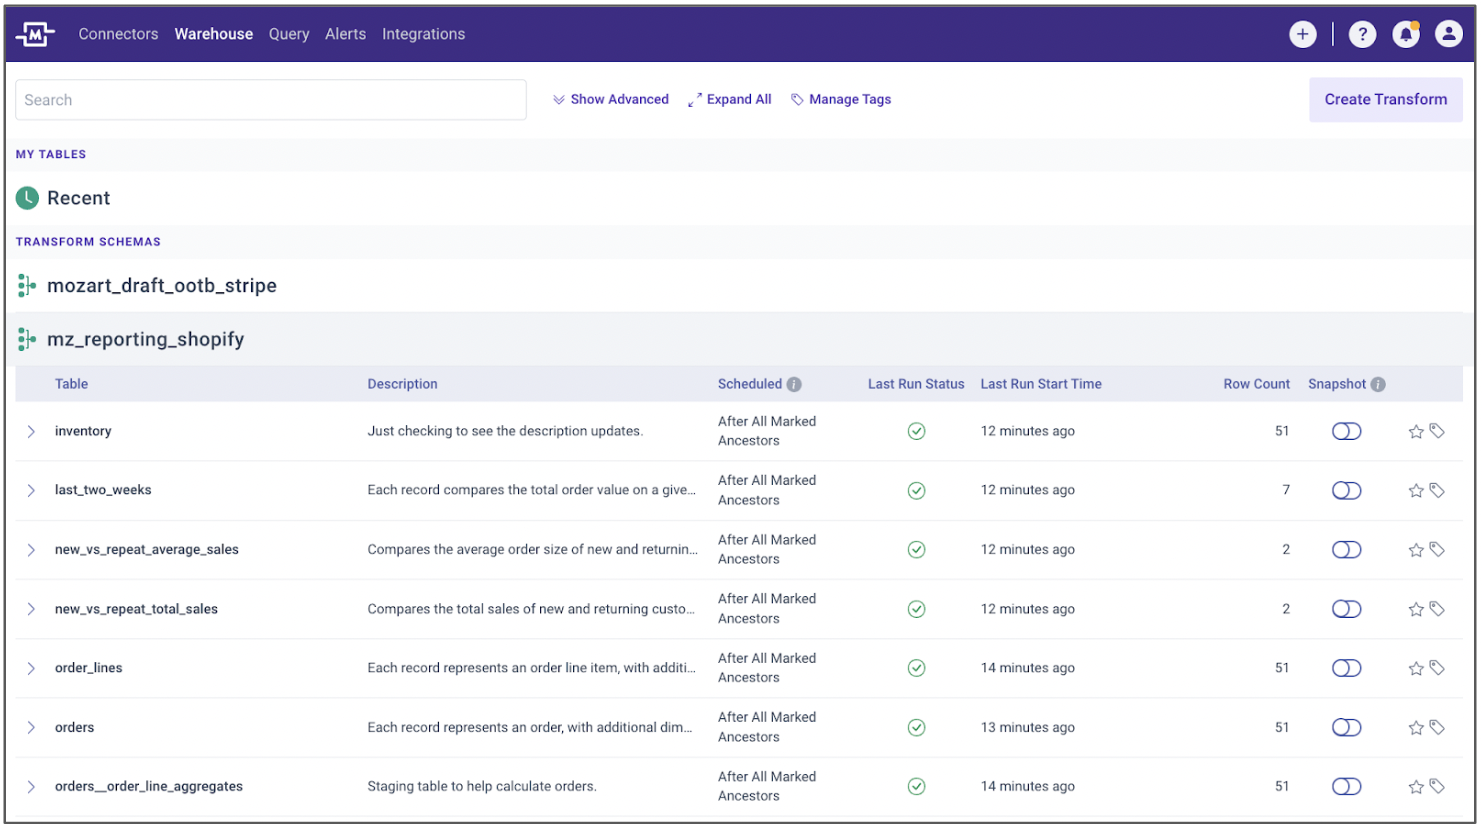
These transforms built by Report Builder are stored in a new schema with the following naming convention: mz_reporting_ + connector_name
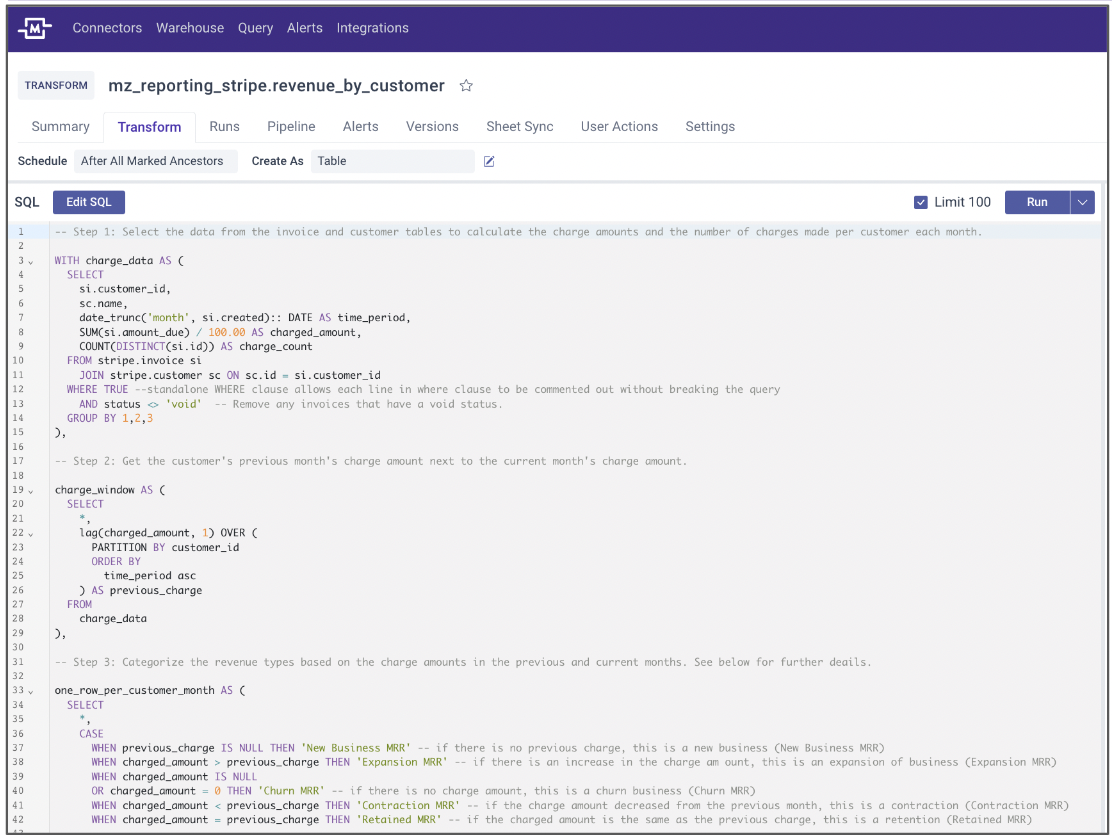
8. To learn more about how each transform is built, click into the transform to view the annotations for each CTE step and conditional and where/filtering clauses.
⚠️ Important Notes
-
Report Builder schedules are in sync with the connector Sync Frequency, which can be modified from the Connectors page.
- For new connectors, the Report Builder process will begin once the data has finished syncing. This may take several hours to days, depending on the data volume. But once the data is finished syncing from the source system to Snowflake data warehouse, it will take less about 10 minutes to generate the transforms and reports.
-
For existing connectors, the Report Builder process will begin as soon as you authorize your Google account and deliver the transforms and report in as little as 10 minutes.
-
You may edit the SQL of the transforms generated by Report Builder. However, we do not recommend changing the structure of the transforms as they may break the Google Sheet report outcomes. Making simple changes like date ranges is totally acceptable.
- To view and do further analyses using Report Builder's transforms in another BI tool, simply connect the Snowflake credentials to the BI tool and you will be able to access the transforms immediately.