Step 1: Get your Data
1. Warehouse
Ok, before you can actually get your data, the first step in the process is setting up your data warehouse to store all of your data. Not to worry! Mozart comes with a Snowflake data warehouse just for you. As a reminder, your warehouse is the consolidated place where all of your data will live (see this Snowflake document around Data Warehouses for more info).
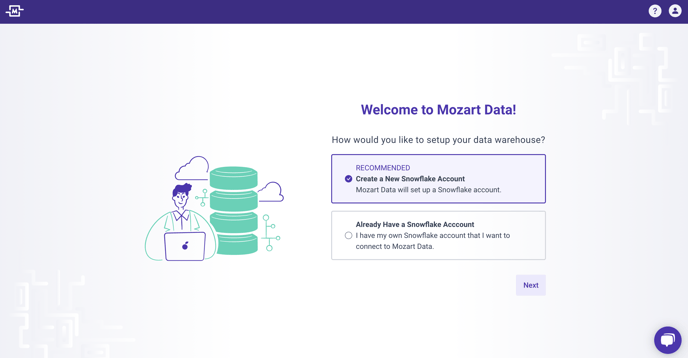
Go to the ‘Setting Up a Warehouse’ document to learn more about connecting your warehouse or setting up a new one.
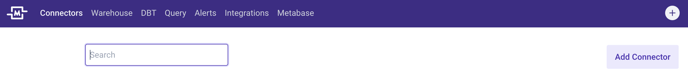
2. Connector
Once you have a place to store your data, we need to get you some data. There are many ways to pull data, but the main path is set up through what we call Connectors. Connectors do what they sound like, they help us connect to your data sources and load the data into the Warehouse. Data sources could be anything, whether it is ads data from Facebook or Google, event data from Segment, invoicing data from Stripe. Different sources have different steps to pull the data, but not to worry, we can walk you through those steps. Go to the ‘Connectors’ page to see more about how to set up your first connector.
Step 2: Explore your data
1. Query Editor
Now that you have data in your warehouse, it’s time to explore it - to transform it, if you will.
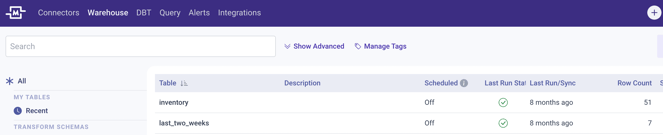
All of the data that you have brought in, currently exists as a table in your Warehouse. To learn more about the features of a Table, go to the ‘Tables’ folder.
Our query editor is the best starting point if you’re trying to play around with the data before committing to anything. You can go to the query editor by clicking the ‘Query’ button at the top. Now, in the editor that has appeared before you, write yourself some SQL!

If you’re wondering what the names of your tables are, we’re here to help. Click the folder button on the right banner and you’ll see a list of all the schemas your tables are under - at this point, you probably have one schema per connector you’ve connected.
Schema vs Table
In case you’re wondering what a schema is, we would describe it kind of like a folder for tables. Schema can categorize tables by topic, by source, by stage in the pipeline. Really however you want. In this case, the raw schema name is whatever you named the connector when setting it up. So, oftentimes, a Shopify schema is called, you guessed it, “Shopify”.
If you click on it, it will show you every table under that schema. For now, choose a table, and type into the query editor
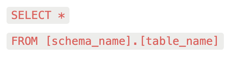
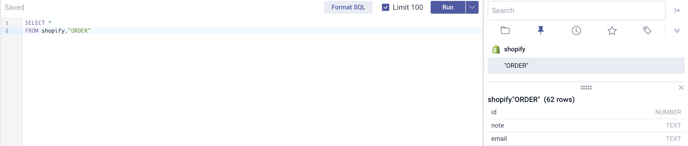
Now click Run on the top and it will query all of the data that exists in that table.
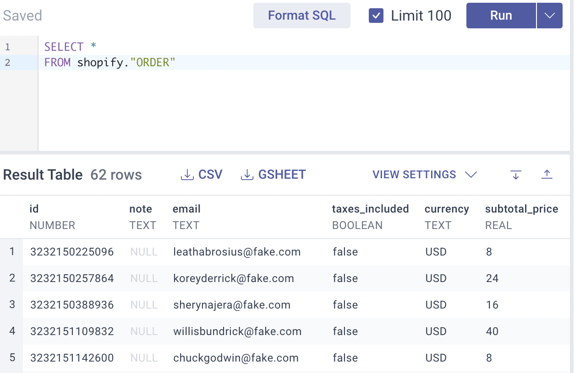
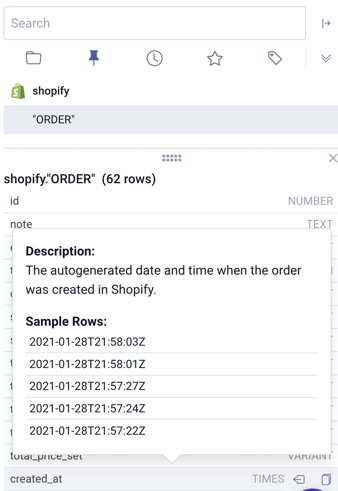
If you’re looking to select only a couple of the columns, in the right banner, click on the name of the table and it’ll display all of the columns that exist in that table, with an example of the values if you hover over the column name.
To note: The SQL we use is SQL through Snowflake. Though much of it is identical to the SQL you would use for MySQL or other databases, for a full list of available functions and syntax, see Snowflake’s SQL Function documentation
To learn more about saving your queries, sharing your queries, or more of the cool features of the query editor, check out the ‘Saved Query’ page.
2. Transform
The next step is to think about what tables you want to save. Whether it be joining tables from multiple sources, aggregating one table you already have, or doing some other kind of transform - we say if you are going to use the same SQL many times, or you want to use a specific table of data in your BI tool, you probably want to save your query as a transform.
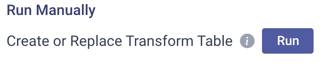
The first time, we recommend going into the Query editor and writing the query that you’re going to want to save for future use. Once your query looks the way you want, click the down arrow on the right of the banner, and select ‘save as transform’. Once saved, go into ‘runs’, click the ‘run’ button, and now you’ve got yourself a whole new table that you can see in your Warehouse page, as well as in the query editor.
To see all about transforms, visit our Transforms Page, which includes information on:
- Scheduling your transform
- Saving your Transform as a table or a view
- Setting Data Alerts, and more.
If you don't run your transform manually and you don't schedule your transform, the table will remain empty - even if you've saved it.
Step 3: Let’s use your data
- Integrations
Now that you have some basic transforms saved, you’re probably thinking about what to do with them. Do you want to visualize the data? Whether it be exporting data to Google Sheets, or connecting to one of the many BI tools that exist, the integrations tab will help you take your data usage to the next step. And if you want to visualize the data but don’t have a BI tool of your own, not to worry! We can provide Metabase for you (for free!) which is a pretty great tool to start visualizing your data with.
The below pictures dictates just some of the integrations we sync with. Don’t see the tool you want to sync data to? No worries. We are able to send data to any tools that integrate with Snowflake.

If you haven't yet generated a Snowflake user, you will need to do so in order to set up integrations. After selecting an integration you'd like to set up, click the button shown below, and type the username for the user you want to create.

We recommend creating one Snowflake user per integration and naming it accordingly (such as MOZART_MODE_USER for a Mode integration), as well as one Snowflake user per individual Mozart user, named accordingly (such as FIRSTNAME_LASTNAME). Remember to save your username and password as they do not get saved within the Mozart interface.
For more information on how to set up your integration, visit the Integrations page here.